Smart Public Toilet Monitoring
Schermate di progetto
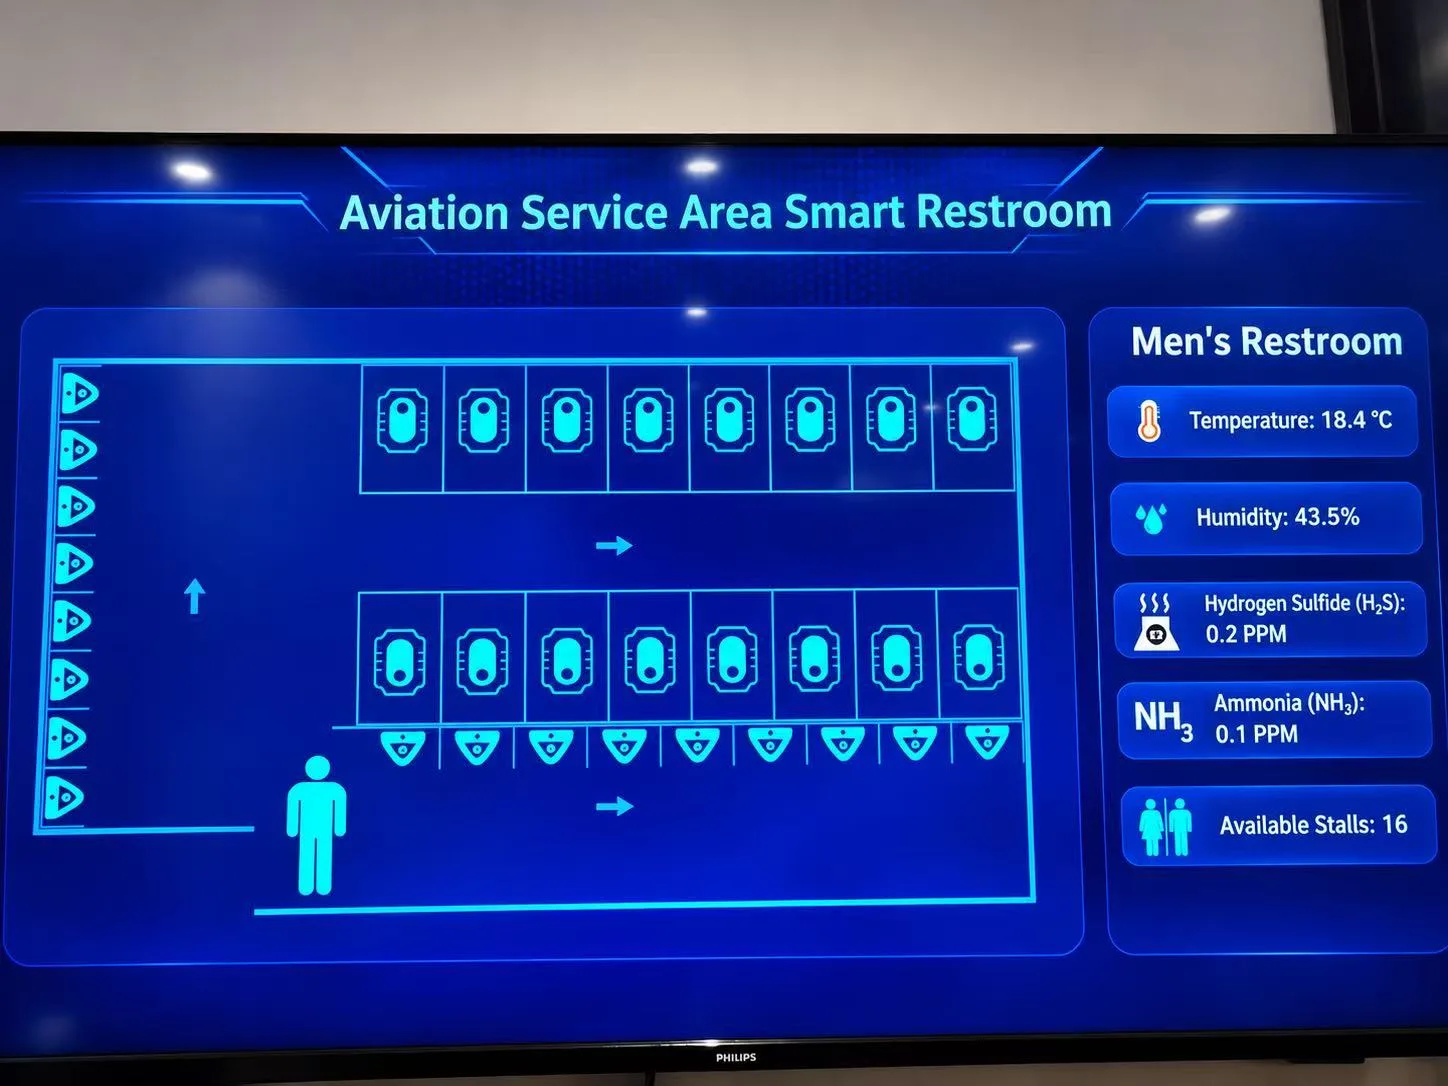
Aviation service area smart restroom – live stall map and men's restroom air quality, customised with X2VIEW. 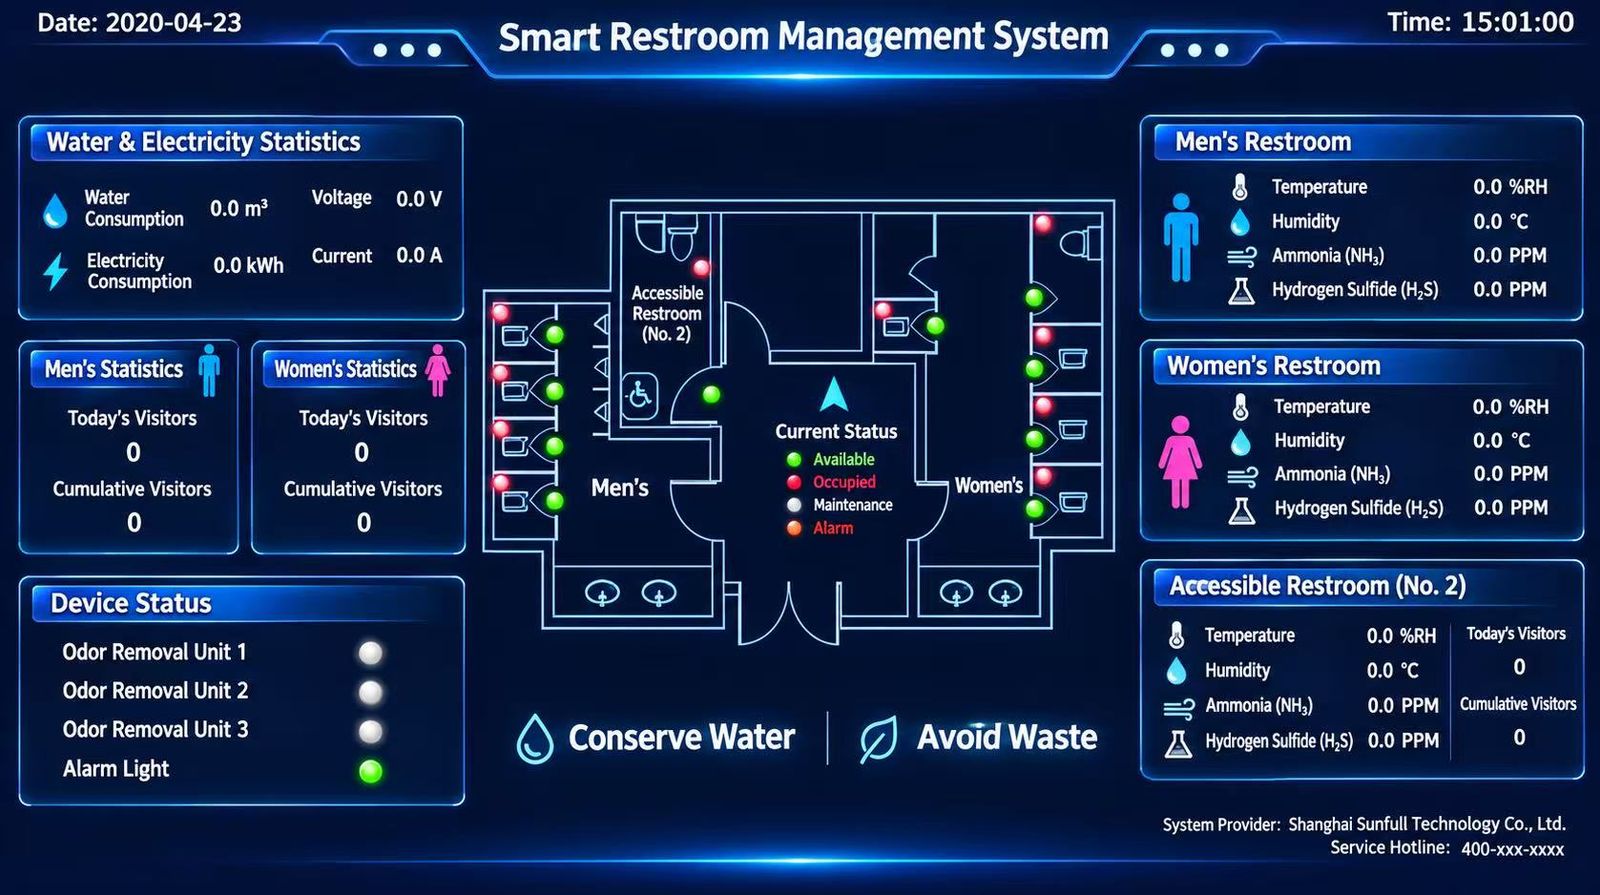
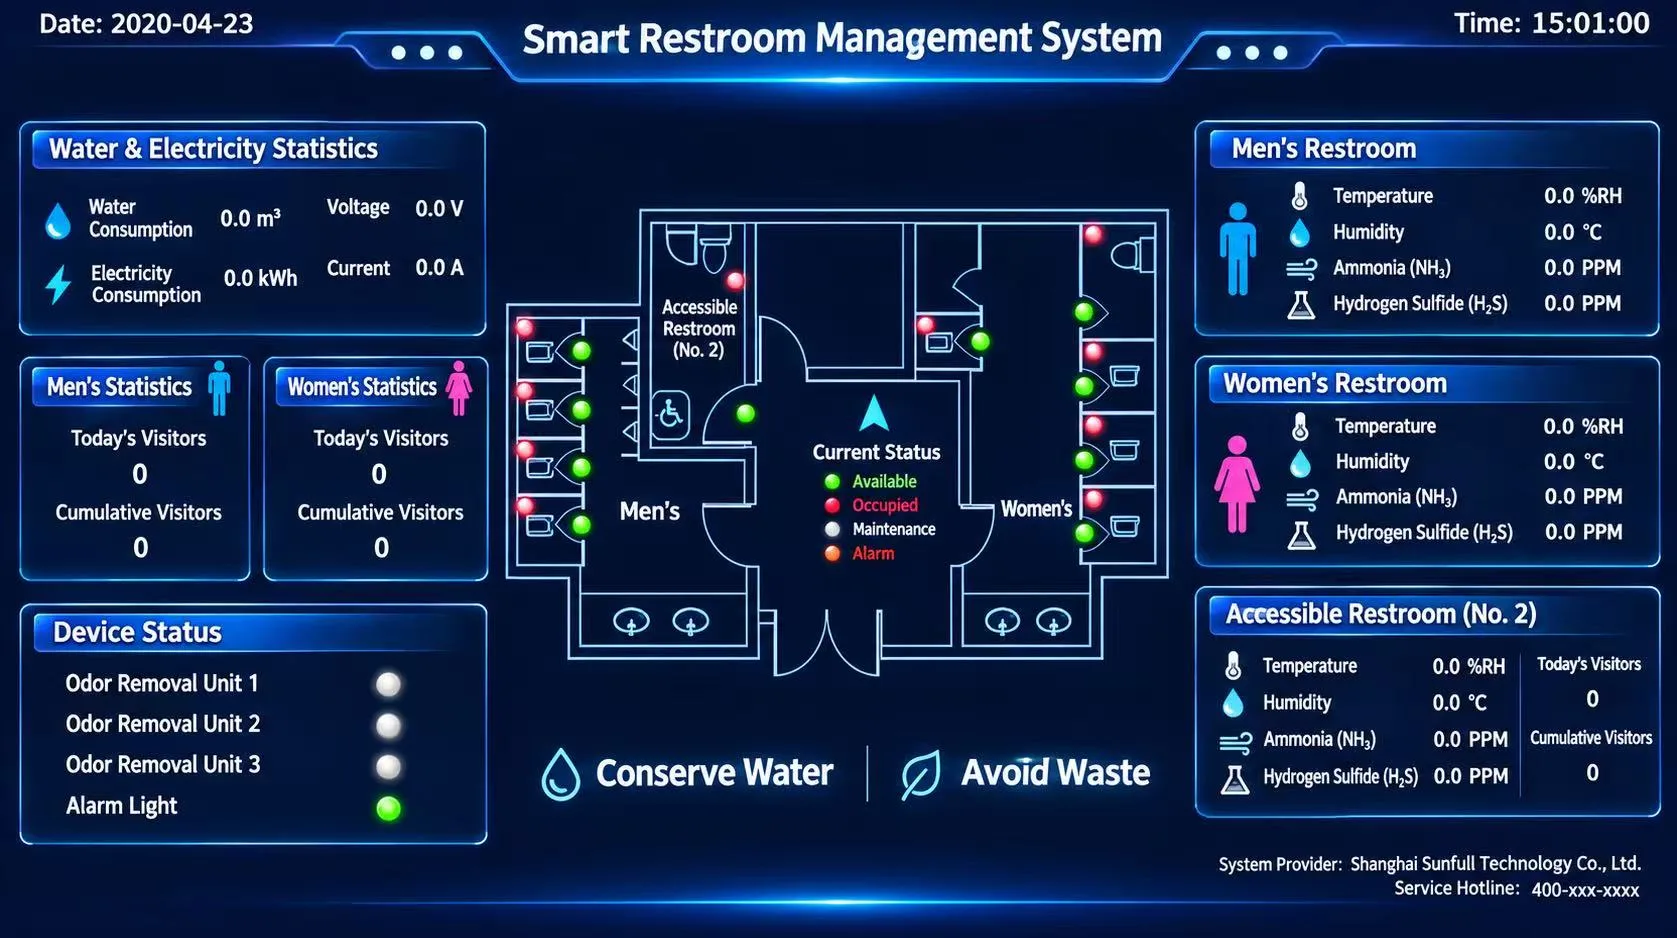
Smart restroom management system – floor plan with stall status, water and power use, visitor counts and odour removal units, customised with X2VIEW. 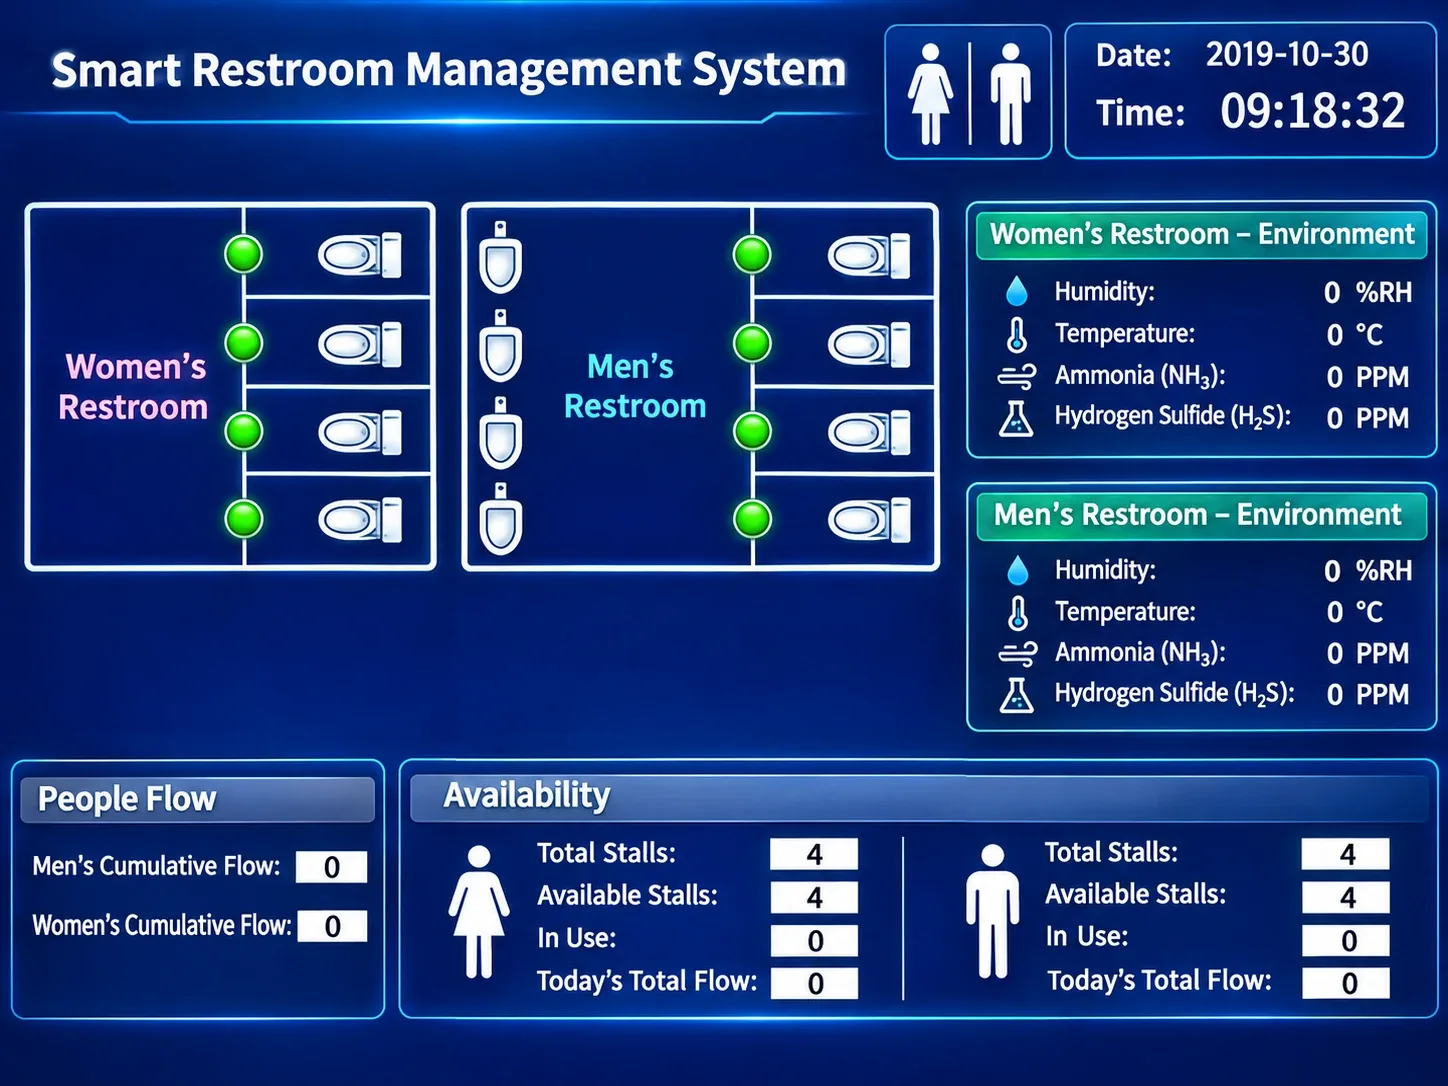
Smart restroom management system – stall availability, people flow and NH3/H2S environment monitoring, customised with X2VIEW.
Punti critici dei clienti
I servizi igienici pubblici tradizionali si affidano spesso a programmi di pulizia prestabiliti e a ispezioni manuali. Di conseguenza, i responsabili della gestione hanno difficoltà a conoscere in tempo reale l’effettivo livello di utilizzo e le condizioni ambientali, con i seguenti problemi:
- Impossibilità di pianificare la pulizia in base alla domanda: la mancanza di dati in tempo reale sull’affluenza e sulla frequenza di utilizzo può causare interventi di pulizia insufficienti nelle ore di punta e ispezioni ripetitive o sprechi di manodopera nei periodi di bassa affluenza.
- Rilevamento tardivo dei cattivi odori: odori causati da ammoniaca, idrogeno solforato e altri gas vengono spesso rilevati solo dopo i reclami degli utenti, compromettendo l’esperienza del pubblico e l’immagine della struttura.
- Mancanza di visibilità in tempo reale sullo stato di utilizzo: i responsabili non possono monitorare da remoto il numero di utenti, il livello di affollamento e lo stato operativo dei servizi igienici, con conseguente scarsa trasparenza delle condizioni sul posto.
- Difficoltà nel rilevare tempestivamente perdite e consumi anomali di acqua: perdite continue durante la notte o nei periodi senza personale possono passare inosservate, causando sprechi d’acqua e potenziali danni alle apparecchiature e alle strutture.
- Bassa efficienza nella gestione di più sedi: aeroporti, centri commerciali, parchi industriali, attrazioni turistiche e progetti municipali spesso dipendono da ispezioni manuali in ogni singola sede, aumentando i costi operativi e rallentando la risposta alle anomalie.
- Mancanza di dati a supporto delle decisioni: senza dati su affluenza, ambiente e consumo idrico, è difficile analizzare i modelli di utilizzo, ottimizzare la frequenza delle pulizie e valutare la qualità operativa.
Panoramica della soluzione
MILESGO gateways collect data from occupancy and people-counting sensors, ammonia / H2S odour sensors, water meters, LoRaWAN wireless sensors over LoRaWAN / Modbus RTU, and deliver it to the city IoT platform, a cloud platform (MQTT), SMS, email and messaging alarms as MQTT. Field equipment keeps its own protocol and control logic; integration is done by configuration and point mapping, not custom code.
Typical scope
- occupancy and people-counting sensors
- ammonia / H2S odour sensors
- water meters
- LoRaWAN wireless sensors
Protocol path
LoRaWAN / Modbus RTU → MQTT
Implementation checklist for the project manager
- Run a LoRaWAN coverage survey and pick the regional band (EU868 / US915 / AU915 / AS923 / KR920 / CN470) before ordering.
- Agree sensor positions (height, airflow, distance from doors and diffusers) so readings are representative.
- Define an alarm matrix (priority, recipient, escalation) and test every alarm end to end at SAT.
- Fix a site / asset naming convention before the first site so data from all sites can be compared.
- Roll out in phases: pilot one site or area, confirm data quality, then replicate.
- Check 4G signal and the SIM data plan at every site before committing to cellular backhaul.
Project deliverables
- Signed point table and protocol mapping
- Gateway configuration files and backups
- IP address plan and network drawing
- FAT and SAT test records
- As-built documentation and operator training
Architettura del sistema
Field layer: occupancy and people-counting sensors, ammonia / H2S odour sensors, water meters, LoRaWAN wireless sensors, connected over LoRaWAN / Modbus RTU. Edge and integration layer: MILESGO protocol gateways and edge controllers, mounted on DIN rail in existing panels, polling each device, time-stamping values and buffering them locally. Upper layer: the city IoT platform, a cloud platform (MQTT), SMS, email and messaging alarms, which receives the data as MQTT. Remote access for maintenance runs over VPN rather than open internet ports.
Composizione del sistema
- Field devices
- occupancy and people-counting sensors, ammonia / H2S odour sensors, water meters, LoRaWAN wireless sensors
- Edge / integration
- MILESGO protocol gateways and edge controllers
- Upper systems
- the city IoT platform, a cloud platform (MQTT), SMS, email and messaging alarms (MQTT)
- Tools and commissioning
- Web-based configuration, point table import/export (Excel), off-site simulation and on-site diagnostic tools
Funzionalità software e IA
- Load and consumption forecastingIn roadmap
Fasi di realizzazione
- 1
Site survey and point list
Inventory devices, protocols, register maps, panel space, power and network paths.
- 2
Design and point table sign-off
Map every point to the target protocol and system; agree it with the client and the upper-system contractor.
- 3
Configuration and FAT
Build the gateway configuration off site, simulate it and test against the signed point table.
- 4
Installation and wiring
Mount gateways on DIN rail, wire RS-485 / I/O / Ethernet, apply the IP plan.
- 5
SAT and alarm tests
Verify values against local readings, test every alarm and command end to end.
- 6
Handover and support
Hand over configuration backups, point table and as-built documents; train operators.
Valore per il cliente
- Abnormal conditions seen early, before they become failures
- Alarms reach the right person by SMS, email or messaging apps
- Unattended sites supervised without permanent staff
- Data ready for cloud platforms and analytics
Altre soluzioni in Smart City & Municipal
Raccontaci il tuo progetto
Indica i protocolli, il numero di punti e il sistema di destinazione. Un team commerciale e tecnico esamina ogni richiesta.
Parliamo del tuo progetto