Smart Public Toilet Monitoring
Ekrany z projektów
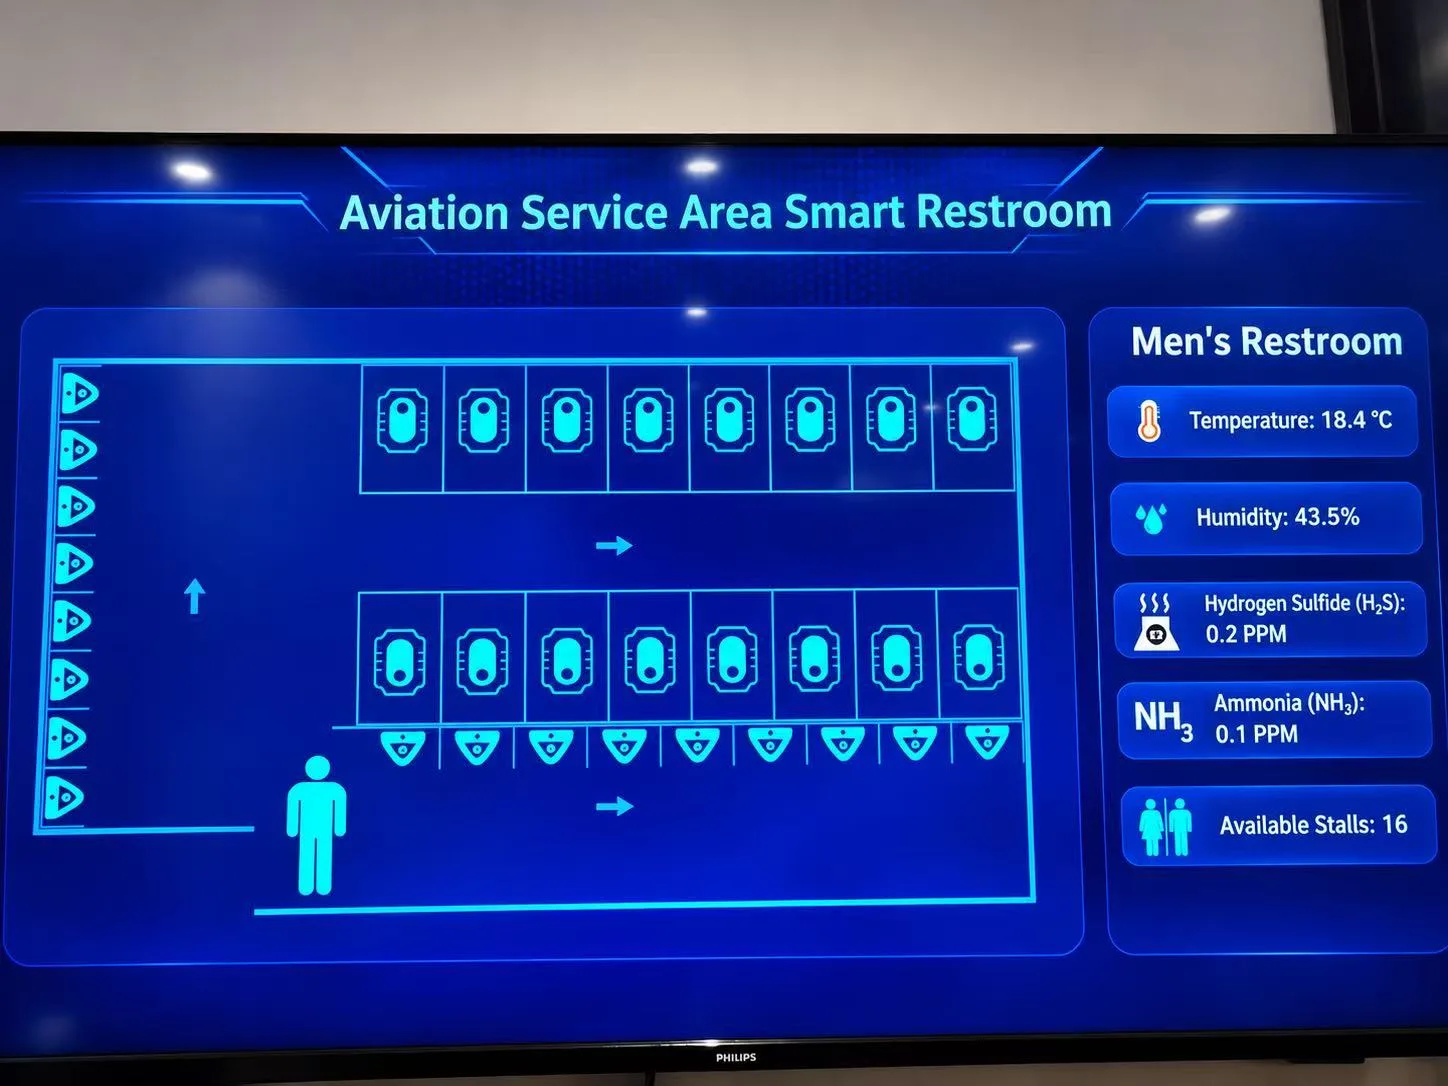
Aviation service area smart restroom – live stall map and men's restroom air quality, customised with X2VIEW. 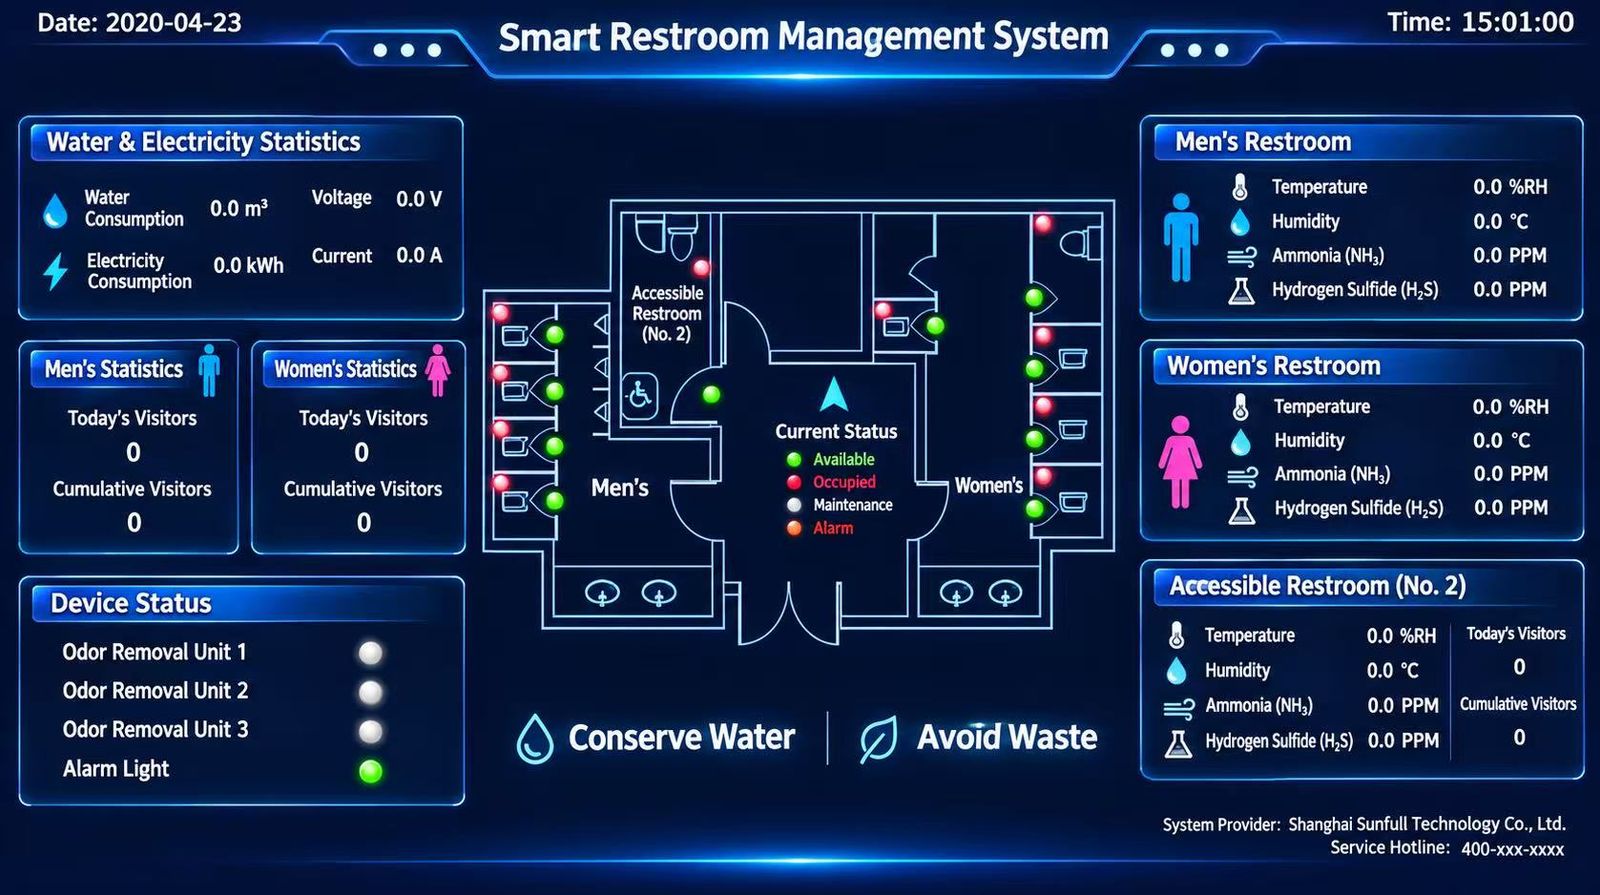
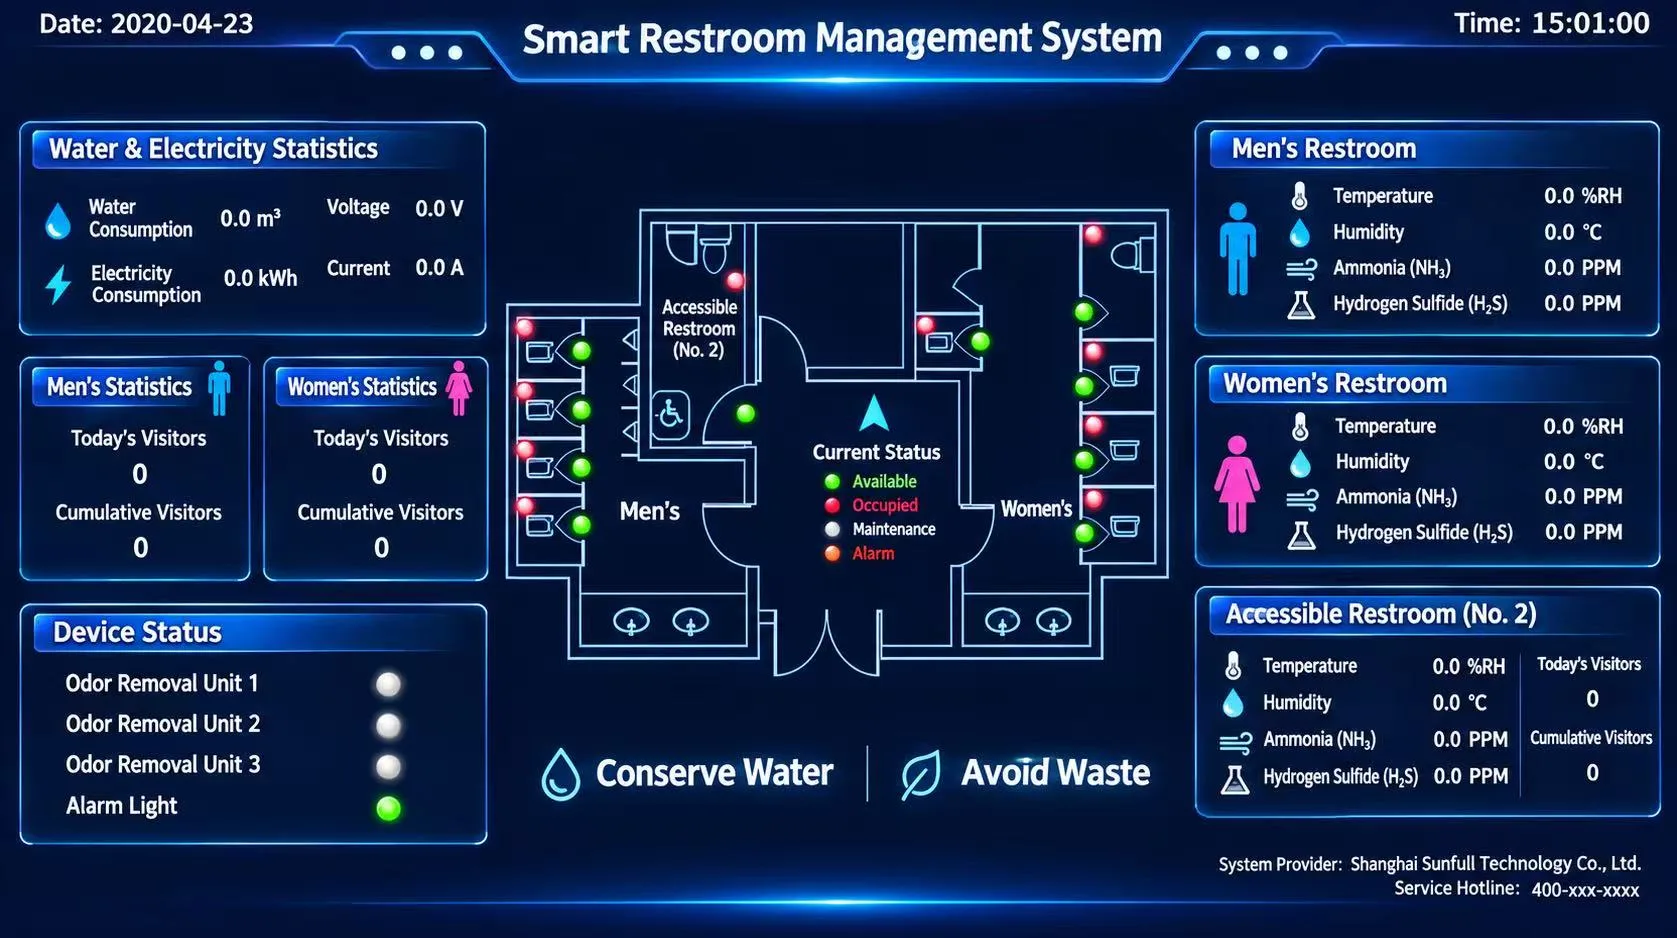
Smart restroom management system – floor plan with stall status, water and power use, visitor counts and odour removal units, customised with X2VIEW. 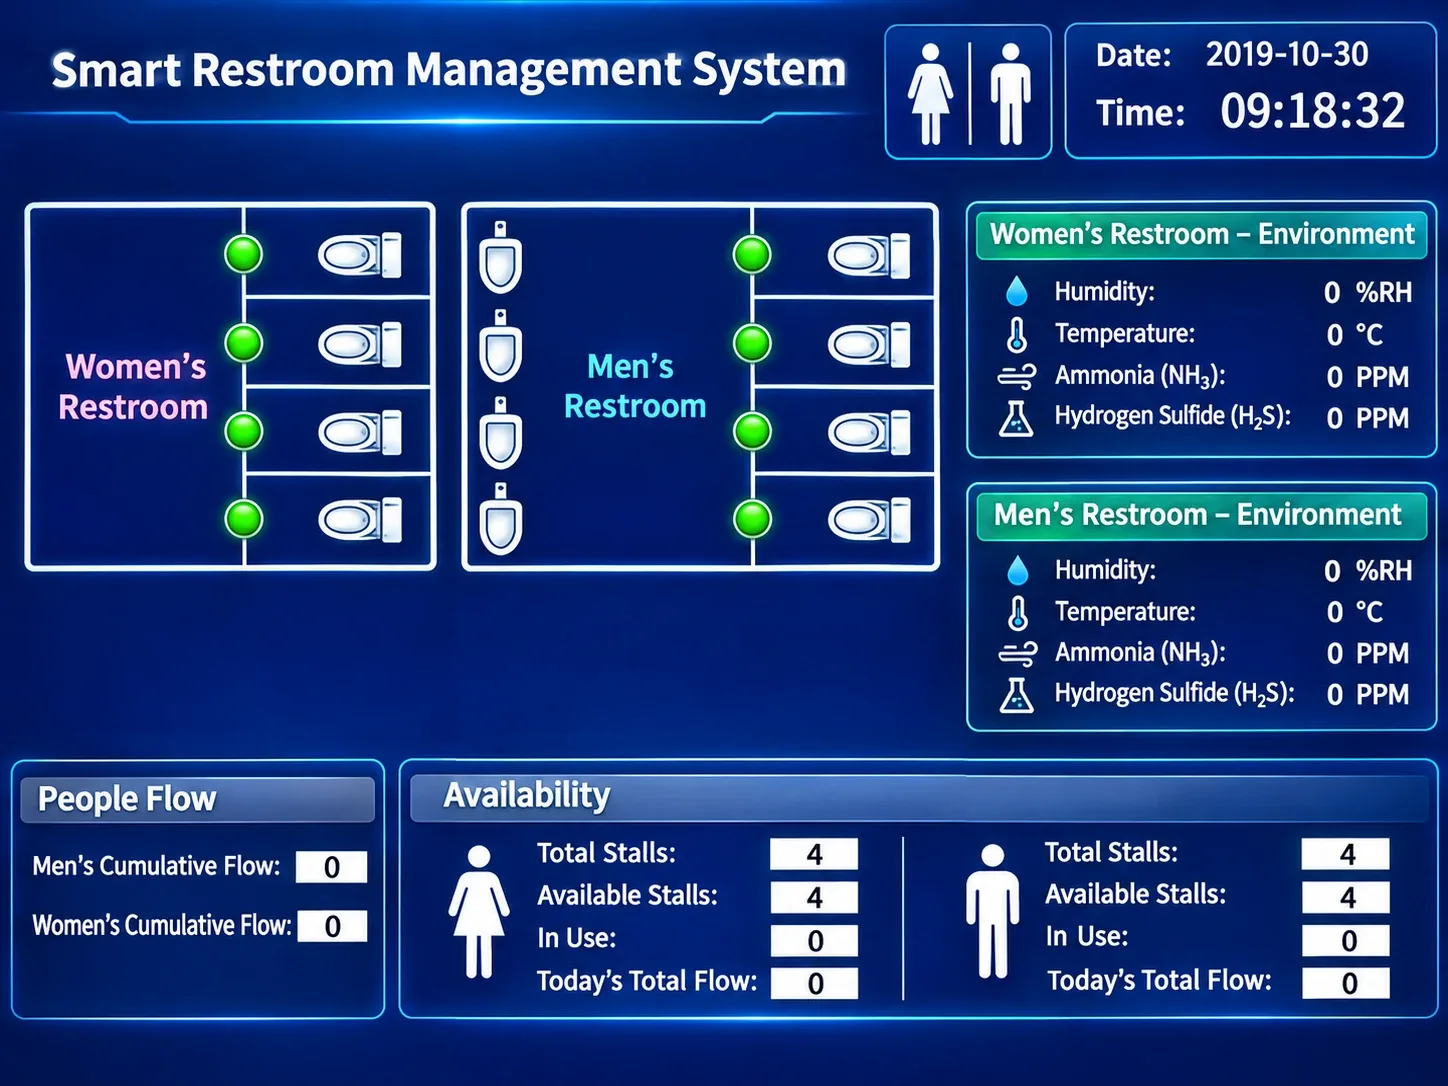
Smart restroom management system – stall availability, people flow and NH3/H2S environment monitoring, customised with X2VIEW.
Problemy klientów
Tradycyjne toalety publiczne często opierają się na stałych harmonogramach sprzątania oraz ręcznych kontrolach. W rezultacie zarządcy mają trudności z bieżącym monitorowaniem rzeczywistego poziomu użytkowania i warunków środowiskowych, co prowadzi do następujących problemów:
- Brak możliwości dostosowania sprzątania do rzeczywistego zapotrzebowania: brak danych w czasie rzeczywistym dotyczących liczby użytkowników i częstotliwości korzystania sprawia, że w godzinach szczytu sprzątanie może być niewystarczające, natomiast poza godzinami szczytu dochodzi do niepotrzebnych kontroli i marnowania zasobów ludzkich.
- Opóźnione wykrywanie nieprzyjemnych zapachów: problemy związane z amoniakiem, siarkowodorem i innymi nieprzyjemnymi zapachami są często wykrywane dopiero po zgłoszeniach użytkowników, co negatywnie wpływa na komfort korzystania z obiektu i jego wizerunek.
- Brak wizualizacji aktualnego stanu użytkowania: zarządcy nie mają możliwości zdalnego monitorowania liczby użytkowników, poziomu obciążenia oraz stanu operacyjnego poszczególnych toalet, przez co sytuacja na miejscu pozostaje mało przejrzysta.
- Trudności w szybkim wykrywaniu wycieków i nietypowego zużycia wody: ciągłe wycieki w nocy lub w okresach bez obsługi mogą długo pozostać niezauważone, powodując straty wody, a nawet uszkodzenia urządzeń i infrastruktury.
- Niska efektywność zarządzania wieloma lokalizacjami: toalety na lotniskach, w centrach handlowych, parkach przemysłowych, atrakcjach turystycznych oraz obiektach komunalnych często wymagają ręcznych kontroli w każdej lokalizacji, co zwiększa koszty operacyjne i wydłuża czas reakcji na nieprawidłowości.
- Brak danych wspierających decyzje zarządcze: bez danych dotyczących liczby użytkowników, warunków środowiskowych i zużycia wody trudno analizować wzorce użytkowania, optymalizować częstotliwość sprzątania oraz oceniać jakość zarządzania obiektem.
Opis rozwiązania
MILESGO gateways collect data from occupancy and people-counting sensors, ammonia / H2S odour sensors, water meters, LoRaWAN wireless sensors over LoRaWAN / Modbus RTU, and deliver it to the city IoT platform, a cloud platform (MQTT), SMS, email and messaging alarms as MQTT. Field equipment keeps its own protocol and control logic; integration is done by configuration and point mapping, not custom code.
Typical scope
- occupancy and people-counting sensors
- ammonia / H2S odour sensors
- water meters
- LoRaWAN wireless sensors
Protocol path
LoRaWAN / Modbus RTU → MQTT
Implementation checklist for the project manager
- Run a LoRaWAN coverage survey and pick the regional band (EU868 / US915 / AU915 / AS923 / KR920 / CN470) before ordering.
- Agree sensor positions (height, airflow, distance from doors and diffusers) so readings are representative.
- Define an alarm matrix (priority, recipient, escalation) and test every alarm end to end at SAT.
- Fix a site / asset naming convention before the first site so data from all sites can be compared.
- Roll out in phases: pilot one site or area, confirm data quality, then replicate.
- Check 4G signal and the SIM data plan at every site before committing to cellular backhaul.
Project deliverables
- Signed point table and protocol mapping
- Gateway configuration files and backups
- IP address plan and network drawing
- FAT and SAT test records
- As-built documentation and operator training
Architektura systemu
Field layer: occupancy and people-counting sensors, ammonia / H2S odour sensors, water meters, LoRaWAN wireless sensors, connected over LoRaWAN / Modbus RTU. Edge and integration layer: MILESGO protocol gateways and edge controllers, mounted on DIN rail in existing panels, polling each device, time-stamping values and buffering them locally. Upper layer: the city IoT platform, a cloud platform (MQTT), SMS, email and messaging alarms, which receives the data as MQTT. Remote access for maintenance runs over VPN rather than open internet ports.
Skład systemu
- Field devices
- occupancy and people-counting sensors, ammonia / H2S odour sensors, water meters, LoRaWAN wireless sensors
- Edge / integration
- MILESGO protocol gateways and edge controllers
- Upper systems
- the city IoT platform, a cloud platform (MQTT), SMS, email and messaging alarms (MQTT)
- Tools and commissioning
- Web-based configuration, point table import/export (Excel), off-site simulation and on-site diagnostic tools
Możliwości oprogramowania i AI
- Load and consumption forecastingW planach
Etapy wdrożenia
- 1
Site survey and point list
Inventory devices, protocols, register maps, panel space, power and network paths.
- 2
Design and point table sign-off
Map every point to the target protocol and system; agree it with the client and the upper-system contractor.
- 3
Configuration and FAT
Build the gateway configuration off site, simulate it and test against the signed point table.
- 4
Installation and wiring
Mount gateways on DIN rail, wire RS-485 / I/O / Ethernet, apply the IP plan.
- 5
SAT and alarm tests
Verify values against local readings, test every alarm and command end to end.
- 6
Handover and support
Hand over configuration backups, point table and as-built documents; train operators.
Korzyści dla klienta
- Abnormal conditions seen early, before they become failures
- Alarms reach the right person by SMS, email or messaging apps
- Unattended sites supervised without permanent staff
- Data ready for cloud platforms and analytics
Więcej rozwiązań w obszarze Smart City & Municipal
Opowiedz nam o swoim projekcie
Prześlij protokoły, liczbę punktów i system docelowy. Każde zgłoszenie analizuje zespół handlowo-inżynierski.
Omów swój projekt